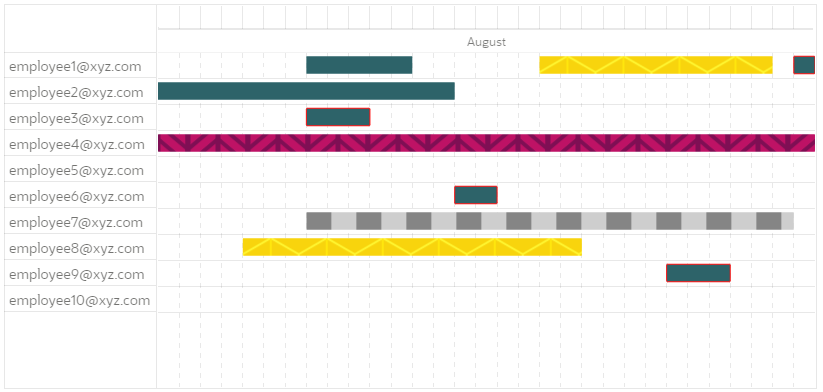
In one of the previous applications I have developed, there was a requirement to show several types of entries in the Gantt chart and I must use visually distinct colors so it would be easy for users to understand which task bar is referring to which task type. Even though there are lot of different colors available technically, distinguishing nearby colors, without keeping them side by side is not easy. Users can recognize basic colors, beyond that it gets tricky. In such cases, we need something beyond colors to fill our charts.
SVG Patterns
SVG Patterns are somewhat similar to HTML5 templates. HTML5 template tag can contain some HTML, but it will not be rendered when page is loaded. Later, we can use the template using JavaScript. In similar fashion, SVG Patterns holds graphic object, but it will not be rendered. However, the pattern can be used for other elements by referencing the pattern in the fill and/or stroke attributes. You can have quick look here to understand more about pattern element.
Now, to use SVG pattern as fill (background color), we first need to define a pattern. So, let's put below pattern code in Page > Header and Footer > Footer Text section.
<svg xmlns="http://www.w3.org/2000/svg" version="1.1">
    <defs>
        <pattern id="honeycomb" patternUnits="userSpaceOnUse" width="56" height="100">
            <rect width='56' height='100' fill='#f8d203' />
            <path d='M28 66L0 50L0 16L28 0L56 16L56 50L28 66L28 100' fill='none' stroke='#fff629' stroke-width='2' />
            <path d='M28 0L28 34L0 50L0 84L28 100L56 84L56 50L28 34' fill='none' stroke='#ffe503' stroke-width='2' />
        </pattern>
    </defs>
</svg>
This code gives us honeycomb pattern. If you want to use any other patterns, you can refer this website. If you like any pattern, just click on the get code button. That should take you to a JSBIN page. There, you can see the SVG code. If you want, you can tweak it according to your needs. After that, copy the SVG code and paste it into APEX page. When you are copying code from JSBIN page, you can use below SVG template. Basically, you have to copy pattern code from JSBIN page and then you need to copy it into pattern tag. Please read inline comments in below SVG code.
<svg xmlns="http://www.w3.org/2000/svg" version="1.1">
    <defs>
        <!--
          give unique id for this pattern, we will use id later to refer this pattern
          copy the SVG element width and height from JSBIN example to here.
        -->
        <pattern id="some_unique_id" patternUnits="userSpaceOnUse" width="56" height="100">
            <!-- copy SVG code from JSBIN to here, excluding SVG tags,   -->
        </pattern>
    </defs>
</svg>
Using SVG Patterns for Gantt Charts
We can define classes for Gantt chart task bars. Using CSS classes, we can refer SVG patterns. For e.g. if Gantt chart task has demo-honeycomb class, then you can use below CSS code to use SVG pattern as background. Observe, we are using the pattern id honeycomb which we have defined in the above step.
path.demo-honeycomb {
  fill: url(#honeycomb);
}
If you are not sure how to specify custom CSS classes for Gantt Chart task bars, you may refer "Colors and Borders" section in Few tips on Gantt Charts blog post.
Using Patterns for Other Chart Types
You can use patterns in other chart types in relatively easy way. For e.g. if you have a Pie chart with multiple defined series and you want to give pattern fill for series 2, then you can do it using below code. You need to put this code in Chart > Attributes > Advanced > JavaScript Initialization Code section.
function( options ){
    // Setup a callback function which gets called when data is retrieved, it allows to manipulate the series
    options.dataFilter = function( data ) {
        data.series[2].pattern = "largeCrosshatch";
        return data;
    };
    // Set chart initialization options
    return options;
}
You can also refer "Area Chart (Color JavaScript Code Customization)" chart in Page-2 in Sample Charts application for similar example. You can refer JET Documentation for list of patterns supported (check DataItem section, look for pattern property).
Thank You.

Comments
You can provide height 0 for svg tag. That should fix the issue.
<svg style="height:0;" xmlns="http://www.w3.org/2000/svg" version="1.1"
Regards,
Hari