Oracle APEX offers several beautiful chart types which are based on Oracle JET Data Visualizations. Gantt Chart is one such beautiful and useful chart. However, when I have searched in Google for some help on Gantt Charts, there are not many blogs posts talking about it. So, I thought, I could write one with few basic tips which I have learned this year.
I have used Gantt Chart to display employees calendar data and my targeted output was something like below.
Looks simple, correct? However, it's little tricky to get there.


I have used Gantt Chart to display employees calendar data and my targeted output was something like below.
 |
| Pic-1 |
Multiple Tasks Per Row:
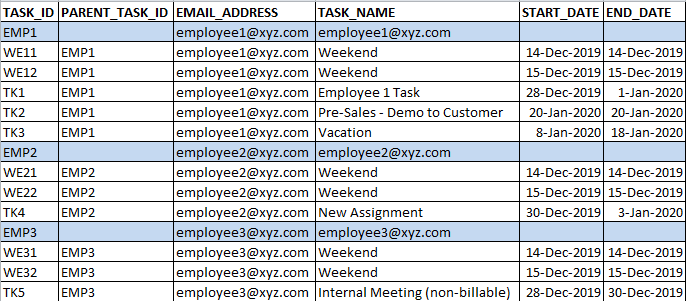
When I look at the output, first I thought, I will have to write a query which gives tasks data and employee data with 1 row per task. That is, if there are 10 tasks to be displayed, then there should be 10 rows in SQL query output. But, it's not correct. Instead, I should have 1 row for each task + 1 row for each employee (parent). So I need to write a query which will output data in below format.
 |
| Pic-2 |
As we can see, there is 1 row per task and also there is 1 row per each employee (highlighted in blue color). Also, observe employee id EMP1 is used as PARENT_TASK_ID for EMP1 tasks.
Next, we need to do column mapping as follows. (Gantt Chart > Series > Column Mapping)
 |
| Pic-3 |
In Page Designer, we can read "Help" text for each option to get more info.
Next, define the timeline for which Gantt chart should be rendered. (Gantt Chart > Series > Timeline)
 |
| Pic-4 |
P6_START_DATE is "Start Date" field and P6_END_DATE is "End Date" field shown in Pic-1 page. P6_END_DATE_HIDDEN is hidden page item calculated based on P6_END_DATE field. We will discuss about this in "Date Handling" section.
By this step, we should have working Gantt chart ready.
Colors and Borders:
As we can see in Pic-1, I have used different colors and borders for different tasks, based on task type and other conditions. For this, I have added new column "CSS_CLASS" in series SQL query. This column gives CSS class(es) name for each task. Next, I need to specify this column name in "Task CSS Classes" section (Gantt Chart > Series > Appearance) as shown below.
 |
| Pic-5 |
Gantt Chart, like any other JET chart, is rendered as "Scalable Vector Graphics". So we have limited style options which we can use. We can use "fill" for "background-color" and "stroke" for "border".
We can put our CSS in "Page > CSS > Inline" section.
e.g. CSS styles
/* orangle fill */
path.demo-f-orange {fill:orange}

/* red border */
path.demo-b-red {
    stroke: red;
    stroke-width: 1px;
}
I found SVG and CSS tutorials useful on this topic.
Dynamic Major, Minor Axes:
On top of the Gantt chart, we can see two axes. One Major Axis and other Minor Axis.
 |
| Pic-6 |
We can define these axes values under "Gantt Chart > Axes" Sections. If we want to display Gantt Chart for a fixed time window, then we can choose appropriate "Time Scale" and "Zoom Scale" for Major and Minor axes. However, if users can select the time window, then fixed axes may not look good in all cases.
Luckily, we can set these options using "JavaScript Initialization Code" (Gantt Chart > Attributes)
In my example, when user selects Start and End dates and submits page, then I have added page computation which will calculate days between start and end dates and saving the value to page item P6_GANTT_DAYS.
Then, I have written below JS code in "JavaScript Initialization Code" section.
function(options) {
  var windowDays = $v("P6_GANTT_DAYS");

  if (windowDays > 0 && windowDays <= 90) {
    options.minorAxis = {
      "scale": "days",
      "zoomOrder": ['quarters', 'months', 'weeks', 'days']
    };
    options.majorAxis = {
      "scale": "months",
      "zoomOrder": ['months', 'weeks', 'days']
    };
  } else if (windowDays > 90 && windowDays <= 270) {
    options.minorAxis = {
      "scale": "months",
      "zoomOrder": ['quarters', 'months', 'weeks', 'days']
    };
    options.majorAxis = {
      "scale": "quarters",
      "zoomOrder": ['quarters', 'months', 'weeks', 'days']
    };
  } else if (windowDays > 270 && windowDays <= 730) {
    options.minorAxis = {
      "scale": "months",
      "zoomOrder": ['quarters', 'months', 'weeks', 'days']
    };
    options.majorAxis = {
      "scale": "years",
      "zoomOrder": ['years', 'quarters', 'months', 'weeks', 'days']
    };
  } else {
    options.minorAxis = {
      "scale": "quarters",
      "zoomOrder": ['quarters', 'months', 'weeks', 'days']
    };
    options.majorAxis = {
      "scale": "years",
      "zoomOrder": ['years', 'quarters', 'months', 'weeks', 'days']
    };
  }

  return options;
}
With this, major and minor axes are set dynamically based on time window selected.
Date Handling:
When we try to render Gantt chart for two days, lets say 01-JAN-2020 as start date and 02-JAN-2020 as end date, then we would see only one day 01-JAN-2020 is displayed in Gantt chart. This is because, when we select date in date picker item, by default, time will be set as 0 hours. So chart will display only 01-JAN-2020. And if we try to display it for one day, by selecting same Start and End dates, then chart will not be rendered at all. To over come this problem, I have created another hidden field P6_END_DATE_HIDDEN. This field value is calculated based on P6_END_DATE (i.e. P6_END_DATE + 1 day)
Highlighting Today's Date:
We can highlight today's date in major or minor axis using JavaScript. Below code shows how we can highlight todays date in minor-axis.
- Create a Dynamic Action and give any proper name like "Highlight Todays Date"
- In "When" Section, select
- Event: After Refresh
- Selection Type: Region
- Region: Gantt Chart Region
- In "True" section, choose "Execute JavaScript Code" action and put below JavaScript code in "Code" section.
var today = new Date();
// by default, dates in major, minor axis are displayed as MM/DD format
// change below code depending on how date format is being displayed
var todayGanttFormat = (today.getMonth() + 1) + "/" + today.getDate();
//console.log(todayGanttFormat);
// gantt-chart is region static id
$("text.oj-gantt-minor-axis-label", "#gantt-chart").each(function() {
  //console.log($(this).html());
  // here we are changing color of today's date to red
  if ($(this).html() == todayGanttFormat)
    $(this).css("fill", "red");
});
Tables Structure and Gantt Chart Query:
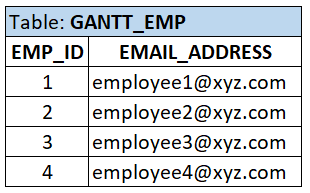
Tables used for this demo and sample data.

Gantt Chart Series SQL Query:
-- employee records
SELECT
    'EMP' || emp.emp_id     task_id,
    NULL                    parent_task_id,
    emp.email_address       email_address,
    emp.email_address       task_name,
    NULL                    start_date,
    NULL                    end_date,
    'EMPLOYEE'              task_type,
    NULL                    css_class,
    NULL                    cust_tooltip
FROM
    gantt_emp emp
UNION ALL
-- employee tasks
SELECT
    'TK' || task.task_id            task_id,
    'EMP' || emp.emp_id             parent_task_id,
    emp.email_address               email_address,
    task.task_name                  task_name,
    task.start_date                 start_date,
    task.end_date + 1 - 1 / 1440    end_date,
    task.task_type,
    CASE
        WHEN task.task_type = 'LEAVE' THEN
                'demo-f-orange'
    END
    || ' '
    ||
    CASE
        WHEN task.billable_flag = 'N' THEN
                'demo-b-red'
        ELSE
            NULL
    END                             css_class,
    task.task_type                  cust_tooltip
FROM
         gantt_emp emp
    JOIN gantt_tasks task ON task.emp_id = emp.emp_id
APEX Versions: 18.2, 19.2
Thank you.
Other posts on this topic:
It's continuation of above blogpost where few more tips about Gantt Chart are discussed. Tips discussed are "Vertical Grid for Minor Axis" and "Dynamic Height for Gantt Chart".
This blog post explains how we can show custom tooltips on Gantt Chart Task bars.
This blog post provides a work around for implementing "Link" feature in Gantt Chart.
Comments
Great post! Thank you.
You wrote e.g. "path.demo-f-orange {fill:orange}" but how or where do I create path.demo-f-orange?
Is it a part of shared component?
You don't need to create anything. Gantt chart task bars are rendered as "path". Gantt chart is SVG chart, it's not html. "path" is a SVG element.
Regards,
I am still confused about the Task CSS classes.
Let say I have three different tasks: A,B and C. Now I createt a new Coloum as "CSS_CLASS" in series SQL query. What should be the result of this query part, if e.g. task A should be filled yellow, task B should be filled orange and task C should be filled red?
Regards, Ruediger
You can attach CSS classes to "Gantt chart task bars" from Gantt Chart SQL query.
e.g. SQL Query
SELECT
/* add columns required for gantt chart */
-- below column for dynamic styling task bars based on task data
,CASE
WHEN task_type = 'A' THEN
'css-class-a'
WHEN task_type = 'B' THEN
'css-class-b'
WHEN task_type = 'C' THEN
'css-class-c'
ELSE 'default-class'
END css_class
FROM your_table
Then you need to specify CSS Column name in "Task CSS Classes" using &css_class. syntax. Please refer "Colors and Borders" section in above blog post.
Next, you need to write CSS code for these classes. You can write CSS code in "Page Properties > CSS > Inline" section.
e.g. CSS code below:
/* css-class-a */
path.css-class-a {fill:orange}
/* css-class-b */
path.css-class-b {
stroke: red;
stroke-width: 1px;
}
Hope it helps.
Thx a lot, Ruediger
I am not aware of any technique using which we can specify grid line only for current date. If you are looking for grid lines for all days, then you can achieve it by swapping the axes. Please refer "Few Tips on Gantt Charts - Part 2" post for more info on this.
If you want to highlight current date somehow, then we can do this using JavaScript. I have updated this blog post with example JavaScript code and demo page has been updated.
options.minorAxis = {"scale":"days"}; i don't see anydays, if i try weeks or months i can see them in the console. therefore it does not match the todayGanttFormat variable and no red line displayed. have you got an idea what is wrong? by the way how could i set the format date dd/mm instead of mm/dd? thank you
For Grid line I tried below js with defining css.
var d = new Date();
var n = d.getDate();
n = n -1
$(".oj-gantt-major-axis-label")[n].attributes[7].value="oj-gantt-major-axis-label newcss"
$(".oj-gantt-vertical-gridline")[n].attributes[5].value="oj-gantt-major-axis-label newcssgrid"
Excellent post. Is it possible to change the shape of the process bar on gantt chart? Because if the task start and end dates are same then process bar on the chart is being shown as a milestone (diamond shape).
Thank you
Yes, you are correct. When start and end dates are same, then the task is displayed as diamond shape (Milestone).
AFAIK, it is not possible to change the shape of tasks bar in Gantt chart. You can explore Oracle JET documentation. Depending on APEX version (and underlying JET version), we can use features available in JET.
Do you know if there is any solution to my problem?
Your post is excellent and it's really great to see an article about this subject.
However, I'm not sure how I can recreate the same output of the query you have as source for this chart. In my case, I have the same structure of the table, but I don't have any clue about how to get the parent row for each employee. Can you provide please the code for this query output?
Thanks and have a nice day!
Thanks for your feedback. I am glad you find it helpful.
I have updated the blogpost and added details about tables used for this demo. I have also added Gantt chart query. I am using UNION to display employee data and tasks data in single query.
There's a distinct lack of documentation, and this blog post answered all of my questions.
Many thanks,
Dave